Kirjaudu sisään
Mathematics for IGCSE & O level - Statistical Diagrams (Section 1 - No. 30)
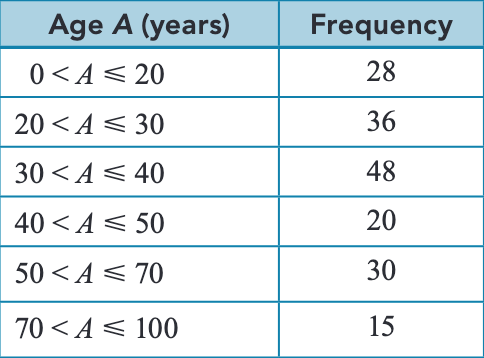
According to the table below, what is the frequency for the 50 ≤ A < 70 age range?
20
30
15
50
Selitys
The frequency for the age group 50 < A ≤ 70 is 30.
Kommentit (0)
Kirjaudu sisään kommentoidaksesi
Mainos
Anna javascriptin ladata tämä sivu oikein